Designing systems that scale across geographies, workloads, and services is at the core of modern software architecture. In this third part of the System Design Deep Dive series, we explore the infrastructure-level strategies and distributed systems patterns that empower you to build resilient, performant, and scalable architectures.
Whether you're preparing for high-stakes interviews or scaling real-world production systems, mastering these concepts—in the right sequence—builds the mental framework you need to design systems that thrive under pressure.
This post dives into:
- Distributed Caching – Reduce latency and backend load
- Bloom Filters – Efficiently check existence before querying caches
- Database Sharding – Horizontally scale your data layer for throughput
- SAGA Pattern – Coordinate distributed transactions with eventual consistency
- Service Discovery with Eureka – Enable dynamic detection of services in distributed setups
- Auto-Scaling with Kubernetes – Automatically scale infrastructure based on load
- Content Delivery Networks (CDNs) – Speed up static content delivery across geographies
Scaling isn’t just about adding servers—it’s about making smart trade-offs. By the end of this deep dive, you’ll know how to scale, why it matters, and when to use each strategy.
Contents
Distributed Caching
Distributed caching is a system where cached data is spread across multiple nodes (servers), enabling applications to access frequently used data with low latency. Unlike single-node caches, distributed caches offer:
- Scalability – Easily scale horizontally by adding/removing nodes.
- High Availability – Avoids single points of failure.
- Consistent Performance – Handles high traffic loads efficiently.
When to Use Distributed Caching
Use distributed caching when:
- You run multiple application servers needing shared state or session data.
- You want to reduce database load and improve read performance.
- You need fast access to frequently used or semi-static data (e.g., user sessions, product catalogs, config values).
Caching Tools
| Tool | Description |
|---|---|
| Redis | Popular in-memory key-value store with support for persistence and pub/sub. |
| Memcached | Lightweight and fast; lacks persistence or complex data types. |
| Hazelcast / Ehcache / Apache Ignite | JVM-based solutions with built-in clustering support. |
Use Case: Product Catalog API
In an e-commerce app with millions of products, the product catalog changes infrequently but is accessed constantly. Caching this can drastically reduce DB load.
Cache Read Example – Spring Boot + Redis
Bloom Filters
A Bloom Filter is a probabilistic data structure used to test whether an element:
- Might be in a set
- Or is definitely not in the set
It is super space-efficient and blazing fast, but allows false positives (never false negatives).
Why Use Bloom Filters?
In large-scale systems, memory and latency are precious. Bloom Filters are commonly used to:
- Avoid expensive cache/database lookups for missing keys
- Prevent duplicate URL visits in web crawlers
- Optimize email spam detection, blockchains, databases, and distributed key-value stores
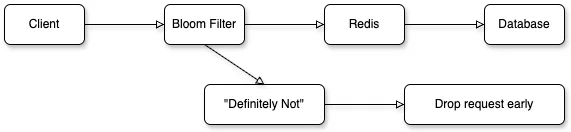
How They Work
- A Bloom filter uses a bit array of size
m, all initialized to 0. - It uses k independent hash functions.
- To insert an element, it's passed through each hash function, and the corresponding bit indices are set to 1.
- To check if an element exists, the same hash functions are used. If all corresponding bits are 1, the item might be in the set. If any bit is 0, the item is definitely not in the set.
Use Case: Cache Lookup Reduction
Imagine you have a caching layer (e.g., Redis) for a product catalog with millions of products.
Problem
Querying Redis for non-existent product IDs puts unnecessary pressure on both Redis and the database.
Solution
Use a Bloom Filter as a first-check before hitting Redis.
Workflow
Example – Using Google Guava
public class ProductCacheChecker {
    private static final BloomFilter<Integer> productFilter =
            BloomFilter.create(Funnels.integerFunnel(), 1_000_000, 0.01);

    public static void main(String[] args) {
        // Insert product IDs
        productFilter.put(101);
        productFilter.put(102);

        // Check existence
        if (productFilter.mightContain(101)) {
            System.out.println("Might exist → Query cache");
        } else {
            System.out.println("Definitely doesn't exist → Skip cache");
        }
    }
}
Bloom Filter Trade-offs
| Pros | Cons |
|---|---|
| Extremely memory-efficient | False positives (tunable error rate) |
| Super fast insert and lookup | Cannot delete entries (in standard version) |
| Ideal for preliminary filtering | Not 100% accurate |
Real-World Applications
- Google Bigtable – Avoid unnecessary disk reads
- Apache HBase – Efficient row scanning and filtering
- Cassandra – Improve SSTable access performance
Database Sharding
Database Sharding is a horizontal scaling technique where large datasets are divided across multiple independent databases called shards. Instead of storing everything in one monolithic database, sharding distributes the data—enabling better performance, scalability, and availability.
Think of a phone book split alphabetically across different people—each person handles a smaller, faster-to-search portion.
Why Use Sharding?
- Scalability: Handles more data by distributing it across multiple machines.
- Performance: Reduces read/write contention and query latency.
- Availability: A failure in one shard doesn't affect the others.
- Geographical Distribution: Place shards closer to users (geo-sharding).
1. Range-Based Sharding
Data is divided based on value ranges.
Example:
- Users with
userId1–10,000 → Shard 1 - Users with
userId10,001–20,000 → Shard 2
Pros:
- Simple to implement
- Easy to understand and debug
Cons:
- Risk of data skew and hotspotting (e.g., all new users go to one shard)
- Not ideal for write-heavy workloads concentrated in one range
2. Hash-Based Sharding
A hash function distributes data based on the sharding key.
int shardId = userId.hashCode() % totalShards;
DataSource ds = shardManager.getDataSource(shardId);
Pros:
- Good uniform data distribution
- Minimizes risk of hotspots
Cons:
- Hard to add/remove shards (requires rehashing all keys)
- Poor locality — range queries are inefficient
3. Geo-Based Sharding
Sharding based on user location or region.
Example:
- Users in US → Shard A
- Users in EU → Shard B
Pros:
- Ideal for latency-sensitive and compliance-heavy applications
- Supports data residency and GDPR
Cons:
- Requires complex routing logic
- Uneven traffic patterns may still lead to hotspots
For a SaaS platform with millions of users, suppose we shard both User and Order data by userId. A ShardRouter class is used to route requests to the appropriate DB shard.
- Shard Manager handles routing
- Each shard has its own DB server (e.g., MySQL)
- Application queries are routed to the right shard
| Challenge | Description |
|---|---|
| Cross-shard queries | Expensive joins/aggregations; require app-side logic or distributed SQL engines |
| Rebalancing shards | Adding/removing shards may need data migration; consider consistent hashing |
| Global indexes | Hard to maintain across distributed data |
| Foreign key constraints | Cannot enforce across shards |
| Operational complexity | Requires shard-aware backups, monitoring, replication, and failover |
- Choose a sharding key that is both uniformly distributed and relevant to queries
- Use a shard manager to centralize routing logic
- Monitor and rebalance hot shards
- Plan for data rebalancing early—pre-split where possible
- Ensure backup and recovery per shard
SAGA Pattern
In modern microservice architectures, maintaining data consistency across distributed services is challenging — especially when traditional distributed transactions (like 2PC) are impractical.
The SAGA Pattern offers a reliable, event-driven alternative. It breaks a business transaction into a series of local transactions, each managed by a service. If a step fails, a compensating action is triggered to undo the partial work, ensuring eventual consistency.
Choreography vs Orchestration
1. Choreography-Based SAGA
- Each service listens to events and performs local actions.
- No central coordinator.
Pros:
- Simple, decentralized
- Easy to scale
Cons:
- Harder to track flow
- Difficult to manage complex workflows
2. Orchestration-Based SAGA
- A central orchestrator controls the entire transaction flow.
- Orchestrator invokes each service and handles compensations.
Pros:
- Better visibility and control
- Easier to handle complex logic or branching
Cons:
- Introduces a central point of control (and potential bottleneck)
- Adds orchestration logic complexity
Use Case: E-Commerce Orders
Let’s walk through a Choreography-based SAGA across three services:
Services Involved:
Order Service→ Creates the orderPayment Service→ Charges the customerInventory Service→ Deducts stock
Each step is asynchronous, triggered by events passed through a messaging system (e.g., Kafka).
Step-by-Step SAGA Flow
Step 1: Create Order (Order Service)
- Action: Save order to DB
- Emit:
OrderCreatedevent
Step 2: Process Payment (Payment Service)
- Listen:
OrderCreated - Action: Charge the customer
- Emit:
PaymentProcessed(on success)PaymentFailed(on failure)
Step 3: Update Inventory (Inventory Service)
- Listen:
PaymentProcessed - Action: Deduct inventory
- Emit:
InventoryUpdated(on success)InventoryUpdateFailed(on failure)
@KafkaListener(topics = "payment-processed")
public void onPaymentProcessed(PaymentProcessedEvent event) {
    try {
        inventoryService.deduct(event.getOrderId());
        kafka.send("inventory-updated", new InventoryUpdatedEvent(event.getOrderId()));
    } catch (Exception e) {
        kafka.send("inventory-update-failed", new InventoryUpdateFailedEvent(event.getOrderId()));
    }
}
Compensation Logic
SAGA ensures rollback via compensating actions when a step fails.
Case 1: Payment Failed
- Handled by: Order Service
- Action: Cancel the order
Case 2: Inventory Update Failed
- Handled by: Payment Service
- Action: Refund the customer
SAGA Responsibility Matrix
| Service | Event Listened To | Action | Compensating Action |
|---|---|---|---|
| Order Service | N/A | Create order | Cancel order on payment failure |
| Payment Service | OrderCreated | Charge payment | Refund on inventory failure |
| Inventory | PaymentProcessed | Deduct stock | None (not responsible) |
SAGA Benefits
- No distributed locks or 2PC needed
- Achieves eventual consistency across services
- Services remain loosely coupled and independently scalable
- Supports graceful failure recovery with compensating actions
SAGA Challenges & Practices
| Best Practice | Why It Matters |
|---|---|
| Make local transactions idempotent | Prevents duplication from retries |
| Design idempotent compensating actions | Avoids over-corrections or double refunds |
| Store a Saga state log or status | Enables retries, auditing, and recovery |
| Use correlation IDs | For traceability across services |
| Use reliable messaging (Kafka, RabbitMQ) | Ensures delivery of critical events |
| Handle timeouts, retries, dead-letter queues | Protects against service outages and network errors |
Service Discovery with Eureka
In a modern microservices architecture, services are dynamic — often scaling up/down or changing locations due to containerization or cloud deployments. Hardcoding service URLs or IPs is unreliable and breaks flexibility.
Service Discovery solves this by allowing services to locate and communicate with each other at runtime.
What is Eureka?
Eureka is a Service Discovery solution developed by Netflix, and it’s a core part of the Spring Cloud ecosystem.
Eureka Architecture Overview
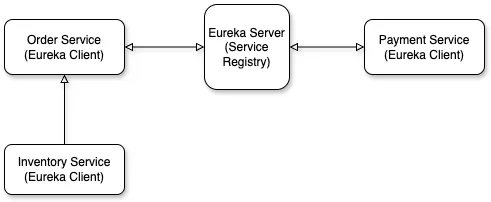
| Component | Role |
|---|---|
| Eureka Server | Acts as a registry where services register and query each other. |
| Eureka Client | Registers with Eureka Server and discovers other registered services. |
Eureka Setup
1. Create Eureka Server
Add Dependency in pom.xml:
<dependency>
    <groupId>org.springframework.cloud</groupId>
    <artifactId>spring-cloud-starter-netflix-eureka-server</artifactId>
</dependency>
Enable Eureka Server:
application.yml:
📍 Access Eureka Dashboard: http://localhost:8761
2. Register a Microservice (e.g., Order Service)
Add Eureka Client Dependency:
application.yml:
When the app starts, it auto-registers with Eureka and appears in the dashboard under order-service.
Inter-Service Communication
If Payment Service wants to call Order Service, it doesn’t need the IP or port. Instead, use service names and let Eureka handle discovery.
RestTemplate Setup with Load Balancer
@Bean
@LoadBalanced
public RestTemplate restTemplate() {
    return new RestTemplate();
}
Call a Service by Name
✔ order-service is resolved by Eureka and load-balanced between instances.
Health Checks & Self-Healing
- Eureka clients send heartbeats every 30 seconds.
- If a service stops heartbeating, it’s marked DOWN and eventually removed.
- This keeps the registry accurate and resilient.
Eureka Benefits
| Feature | Benefit |
|---|---|
| Dynamic Registration | No need to hardcode service URLs or IPs |
| Load Balancing | Works with Ribbon or Spring Cloud LoadBalancer |
| Fault Tolerance | Integrates with Hystrix or Resilience4J for graceful fallbacks |
| Real-time Monitoring | UI dashboard shows registered services and health status |
Eureka Best Practices
- Use logical and consistent service names (e.g.,
order-service,inventory-service). - Prefer
@LoadBalancedRestTemplate or Feign clients for service communication. - Enable retries and fallbacks for resilience (e.g., Resilience4J).
- Monitor service health via Eureka dashboard and metrics.
Auto-Scaling with Kubernetes
Kubernetes Auto-Scaling dynamically adjusts application resources based on demand—helping you maintain performance without over-provisioning.
With auto-scaling, your application:
- Scales out during high traffic (adds more pods)
- Scales in during low usage (removes pods)
- Optimizes cost and infrastructure performance
Types of Auto-Scaling in Kubernetes
| Type | Description |
|---|---|
| HPA (Horizontal Pod Autoscaler) | Scales the number of pods based on CPU, memory, or custom metrics |
| VPA (Vertical Pod Autoscaler) | Adjusts CPU/memory requests and limits for a pod |
| Cluster Autoscaler (CA) | Adds/removes nodes in the cluster based on pod scheduling needs |
Horizontal Pod Autoscaler (HPA)
Best For:
- Stateless microservices
- APIs and frontend/backend services
- Dynamic workloads
How HPA Works:
- Kubernetes monitors metrics like CPU or memory utilization.
- If a defined threshold is exceeded, it increases the number of pod replicas.
- When usage drops, it scales back down (respecting min/max limits).
Example: HPA Based on CPU Utilization
Step 1: Define a Deployment
apiVersion: apps/v1
kind: Deployment
metadata:
  name: web-api
spec:
  replicas: 2
  selector:
      matchLabels:
          app: web-api
  template:
      metadata:
          labels:
              app: web-api
      spec:
          containers:
          - name: web-api
              image: myorg/web-api:latest
              resources:
                  requests:
                      cpu: "250m"
                  limits:
                      cpu: "500m"
              ports:
              - containerPort: 8080
Step 2: Define HPA YAML
apiVersion: autoscaling/v2
kind: HorizontalPodAutoscaler
metadata:
  name: web-api-hpa
spec:
  scaleTargetRef:
      apiVersion: apps/v1
      kind: Deployment
      name: web-api
  minReplicas: 2
  maxReplicas: 10
  metrics:
    - type: Resource
        resource:
          name: cpu
          target:
              type: Utilization
              averageUtilization: 60
This configuration tells Kubernetes:
"If average CPU utilization exceeds 60%, scale up (max 10 pods). If it drops below, scale down (min 2 pods)."
Test HPA with Load
You can simulate high traffic using a tool like hey:
hey -n 10000 -c 100 http://<your-service-ip>/api/resourceMonitor HPA behavior:
kubectl get hpaVertical Pod Autoscaler (VPA)
Instead of increasing pod count, VPA adjusts the CPU and memory allocated to each pod.
Best For:
- Machine learning jobs
- Batch workloads
- Memory-intensive services
Example: VPA with Auto Mode
apiVersion: autoscaling.k8s.io/v1
kind: VerticalPodAutoscaler
metadata:
  name: web-api-vpa
spec:
  targetRef:
      apiVersion: "apps/v1"
      kind: Deployment
      name: web-api
  updatePolicy:
      updateMode: "Auto"
In Auto mode, Kubernetes will restart the pod with adjusted CPU/memory values based on actual usage patterns.
Cluster Autoscaler (CA)
If Kubernetes cannot schedule a pod due to lack of node-level resources, the Cluster Autoscaler adds new nodes to the cluster.
Setup:
- Enabled at cluster level (GKE, EKS, AKS, etc.)
- Integrates with cloud provider’s compute autoscaling
- Automatically scales nodes, not pods
CA only kicks in when a pod is unschedulable due to resource limits.
Auto-Scaling Best Practices
| Best Practice | Why It Matters |
|---|---|
| Set resource requests/limits | HPA requires these metrics to determine scaling thresholds |
| Use custom metrics if needed | CPU may not reflect true load (e.g., I/O-bound or async workloads) |
| Monitor with Prometheus/Grafana | Helps visualize metrics and identify bottlenecks |
| Combine HPA + VPA cautiously | Avoid conflicts—both scale resources differently and may interfere |
Content Delivery Networks
A Content Delivery Network (CDN) is a globally distributed network of edge servers and proxy nodes that cache and serve your web content—such as HTML, CSS, JavaScript, images, and videos—from locations closer to your users.
Rather than relying solely on your origin server, CDNs drastically improve performance by reducing latency, accelerating load times, and increasing reliability.
Why Use a CDN?
| Benefit | Description |
|---|---|
| Faster Delivery | Reduces time-to-first-byte (TTFB) by serving assets from nearby edge nodes |
| Lower Origin Load | Offloads bandwidth and compute from your origin server |
| Higher Availability | Automatically reroutes traffic during node failures |
| Global Reach | Delivers consistent performance worldwide |
| Built-in Security | TLS termination, DDoS mitigation, WAFs, and bot protection |
How CDNs Work
- A user requests a static asset (e.g., an image or
.jsfile). - DNS directs the request to the nearest CDN edge node.
- If the asset is cached (cache hit), it's returned instantly.
- If not cached (cache miss), the CDN fetches it from your origin, stores it, and delivers it to the user.

Key Components
- PoP (Point of Presence): CDN data centers placed near users (e.g., major cities).
- Edge Server: Delivers cached content from the closest PoP.
- Origin Server: Your backend infrastructure, used only when needed.
Use Case: JS via CDN
Instead of hosting jQuery or Bootstrap on your server:
<!-- Load Bootstrap via CDN -->
<script src="https://cdn.jsdelivr.net/npm/bootstrap@5.3.0/dist/js/bootstrap.bundle.min.js"></script>- Likely already cached in the user’s browser or ISP’s edge node.
- Loads faster than pulling from your server.
CDN Caching & Headers
CDNs follow your origin server’s cache headers. Properly setting them ensures efficient cache behavior:
Recommended Headers
| Header | Purpose |
|---|---|
Cache-Control | public, max-age=31536000 – Cache asset for 1 year |
ETag | Cache validation without full downloads |
Vary | Enables content negotiation (e.g., by language or encoding) |
Expires | Deprecated but still respected by many CDNs |
CDN Security Features
Most leading CDNs (e.g., Cloudflare, Akamai, Fastly) offer:
- TLS Termination – Serve HTTPS from the edge
- DDoS Mitigation – Detects and blocks volumetric attacks
- Web Application Firewall (WAF) – Protects against XSS, SQLi, etc.
- Bot & Rate Limiting – Control abusive traffic or scraping
CDN Best Practices
| Tip | Why It Matters |
|---|---|
| Serve static assets via CDN | Reduces load on your backend and improves performance |
| Use compression (GZIP/Brotli) | Shrinks file size for faster delivery |
Version your files (e.g., .v2.js) | Ensures users get latest assets after deployment |
Set long max-age headers | Improve cache longevity and reduce bandwidth |
| Monitor via analytics | Optimize cache hit rates, regional usage, and user experience |
Final Thoughts
Scaling distributed systems is a multi-dimensional challenge—one that requires not just clever code, but architectural foresight.
By strategically applying techniques like distributed caching, bloom filters, database sharding, and orchestration patterns, you can design systems that scale horizontally, fail gracefully, and perform under real-world pressure.
Every layer—from service discovery and auto-scaling Kubernetes clusters to global CDNs—adds resilience, responsiveness, and robustness to your infrastructure.
Make these strategies a core part of your system design toolkit. When you internalize their purpose and trade-offs, you’re not just solving today’s problems—you’re future-proofing your systems for the demands of tomorrow.
📌 Enjoyed this post? Bookmark it and drop a comment below — your feedback helps keep the content insightful and relevant!